Platform analytics
The CM dashboard: eight tabs, two Sankeys, and the counting rules behind every number.
TL;DRAI summary
This chapter explains Cypress's main analytics dashboard, covering what each report tells you about your sales, money, and clients. You'll learn how to interpret the data, including how sales are counted, to get clear insights into your business performance.
For: Cypress Managers — this is the business-wide dashboard. Sellers reading demand on their own vehicles want Your selling analytics instead.
Admin → Analytics is the platform's instrument panel. This chapter tours the tabs, teaches you to read a Sankey, and — most importantly — states the counting rules, because a number you can't define is a number you can't defend.
The stage selector — one definition for the whole page
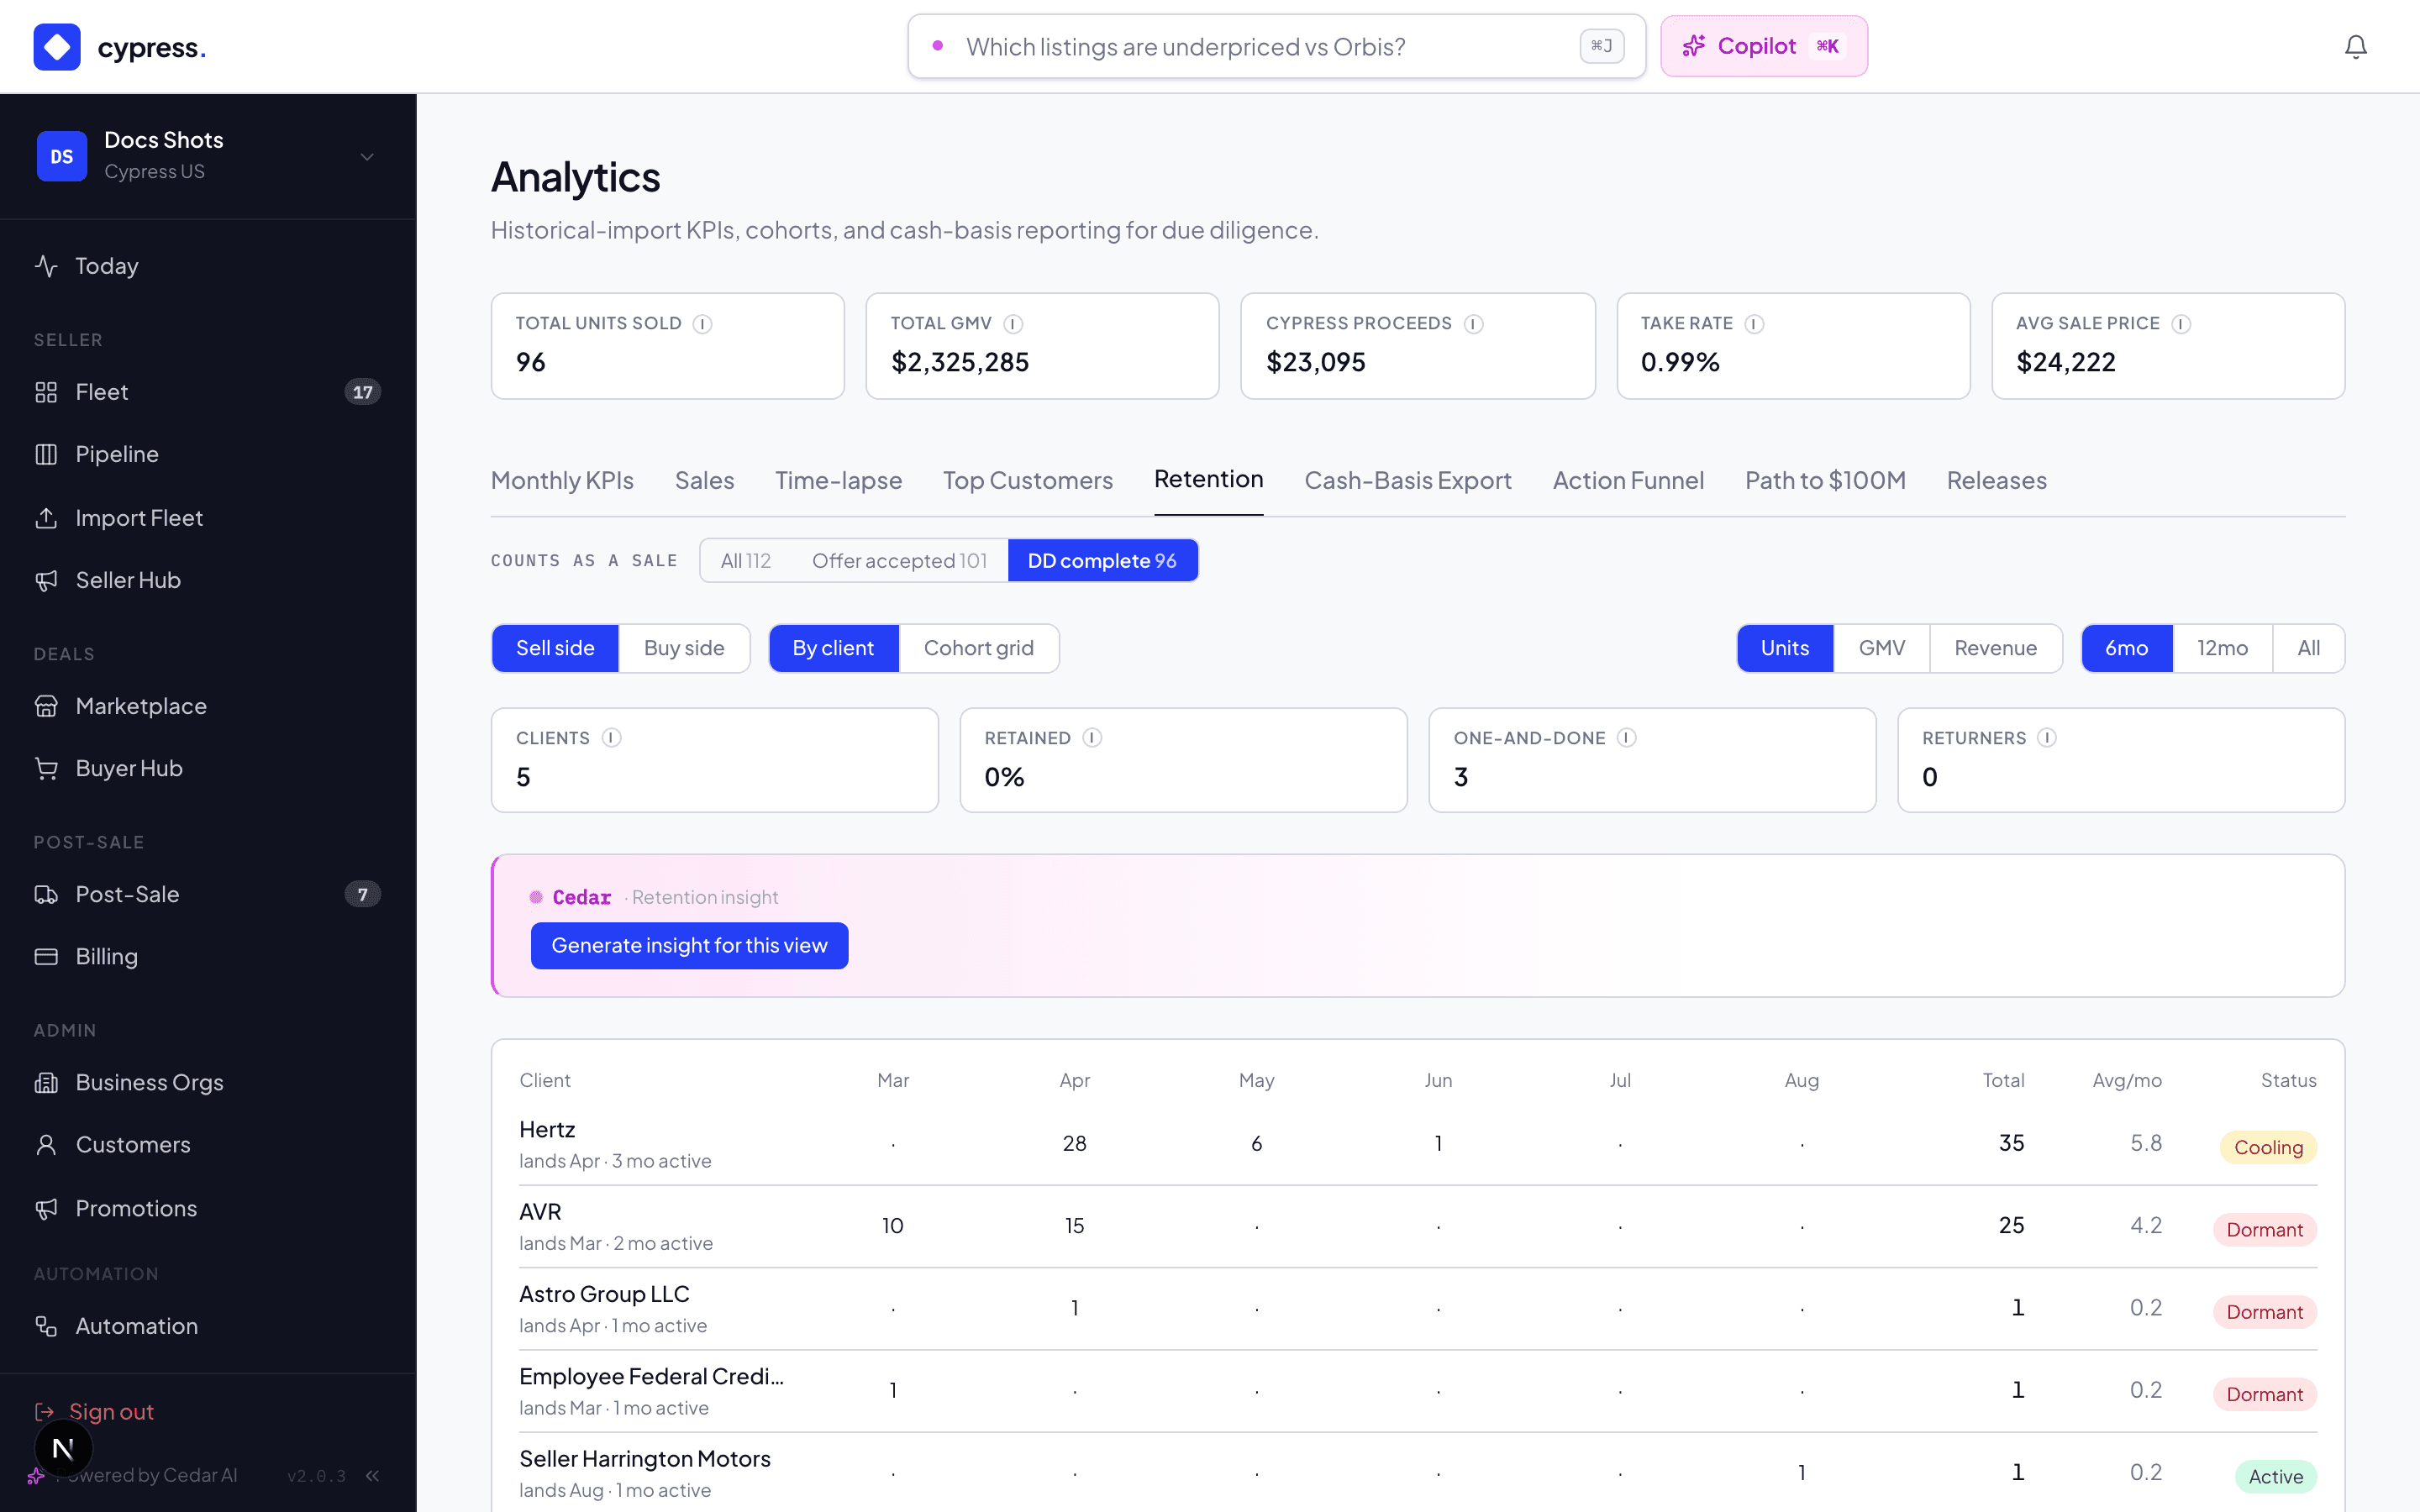
At the top of the page sits a stage selector that governs every tab at once: count a sale when it was recorded, when the offer was accepted, or when due diligence completed (the default, and the report's historical definition). One selector, one definition, no two tabs disagreeing — change it and the whole page recomputes together.
The eight tabs
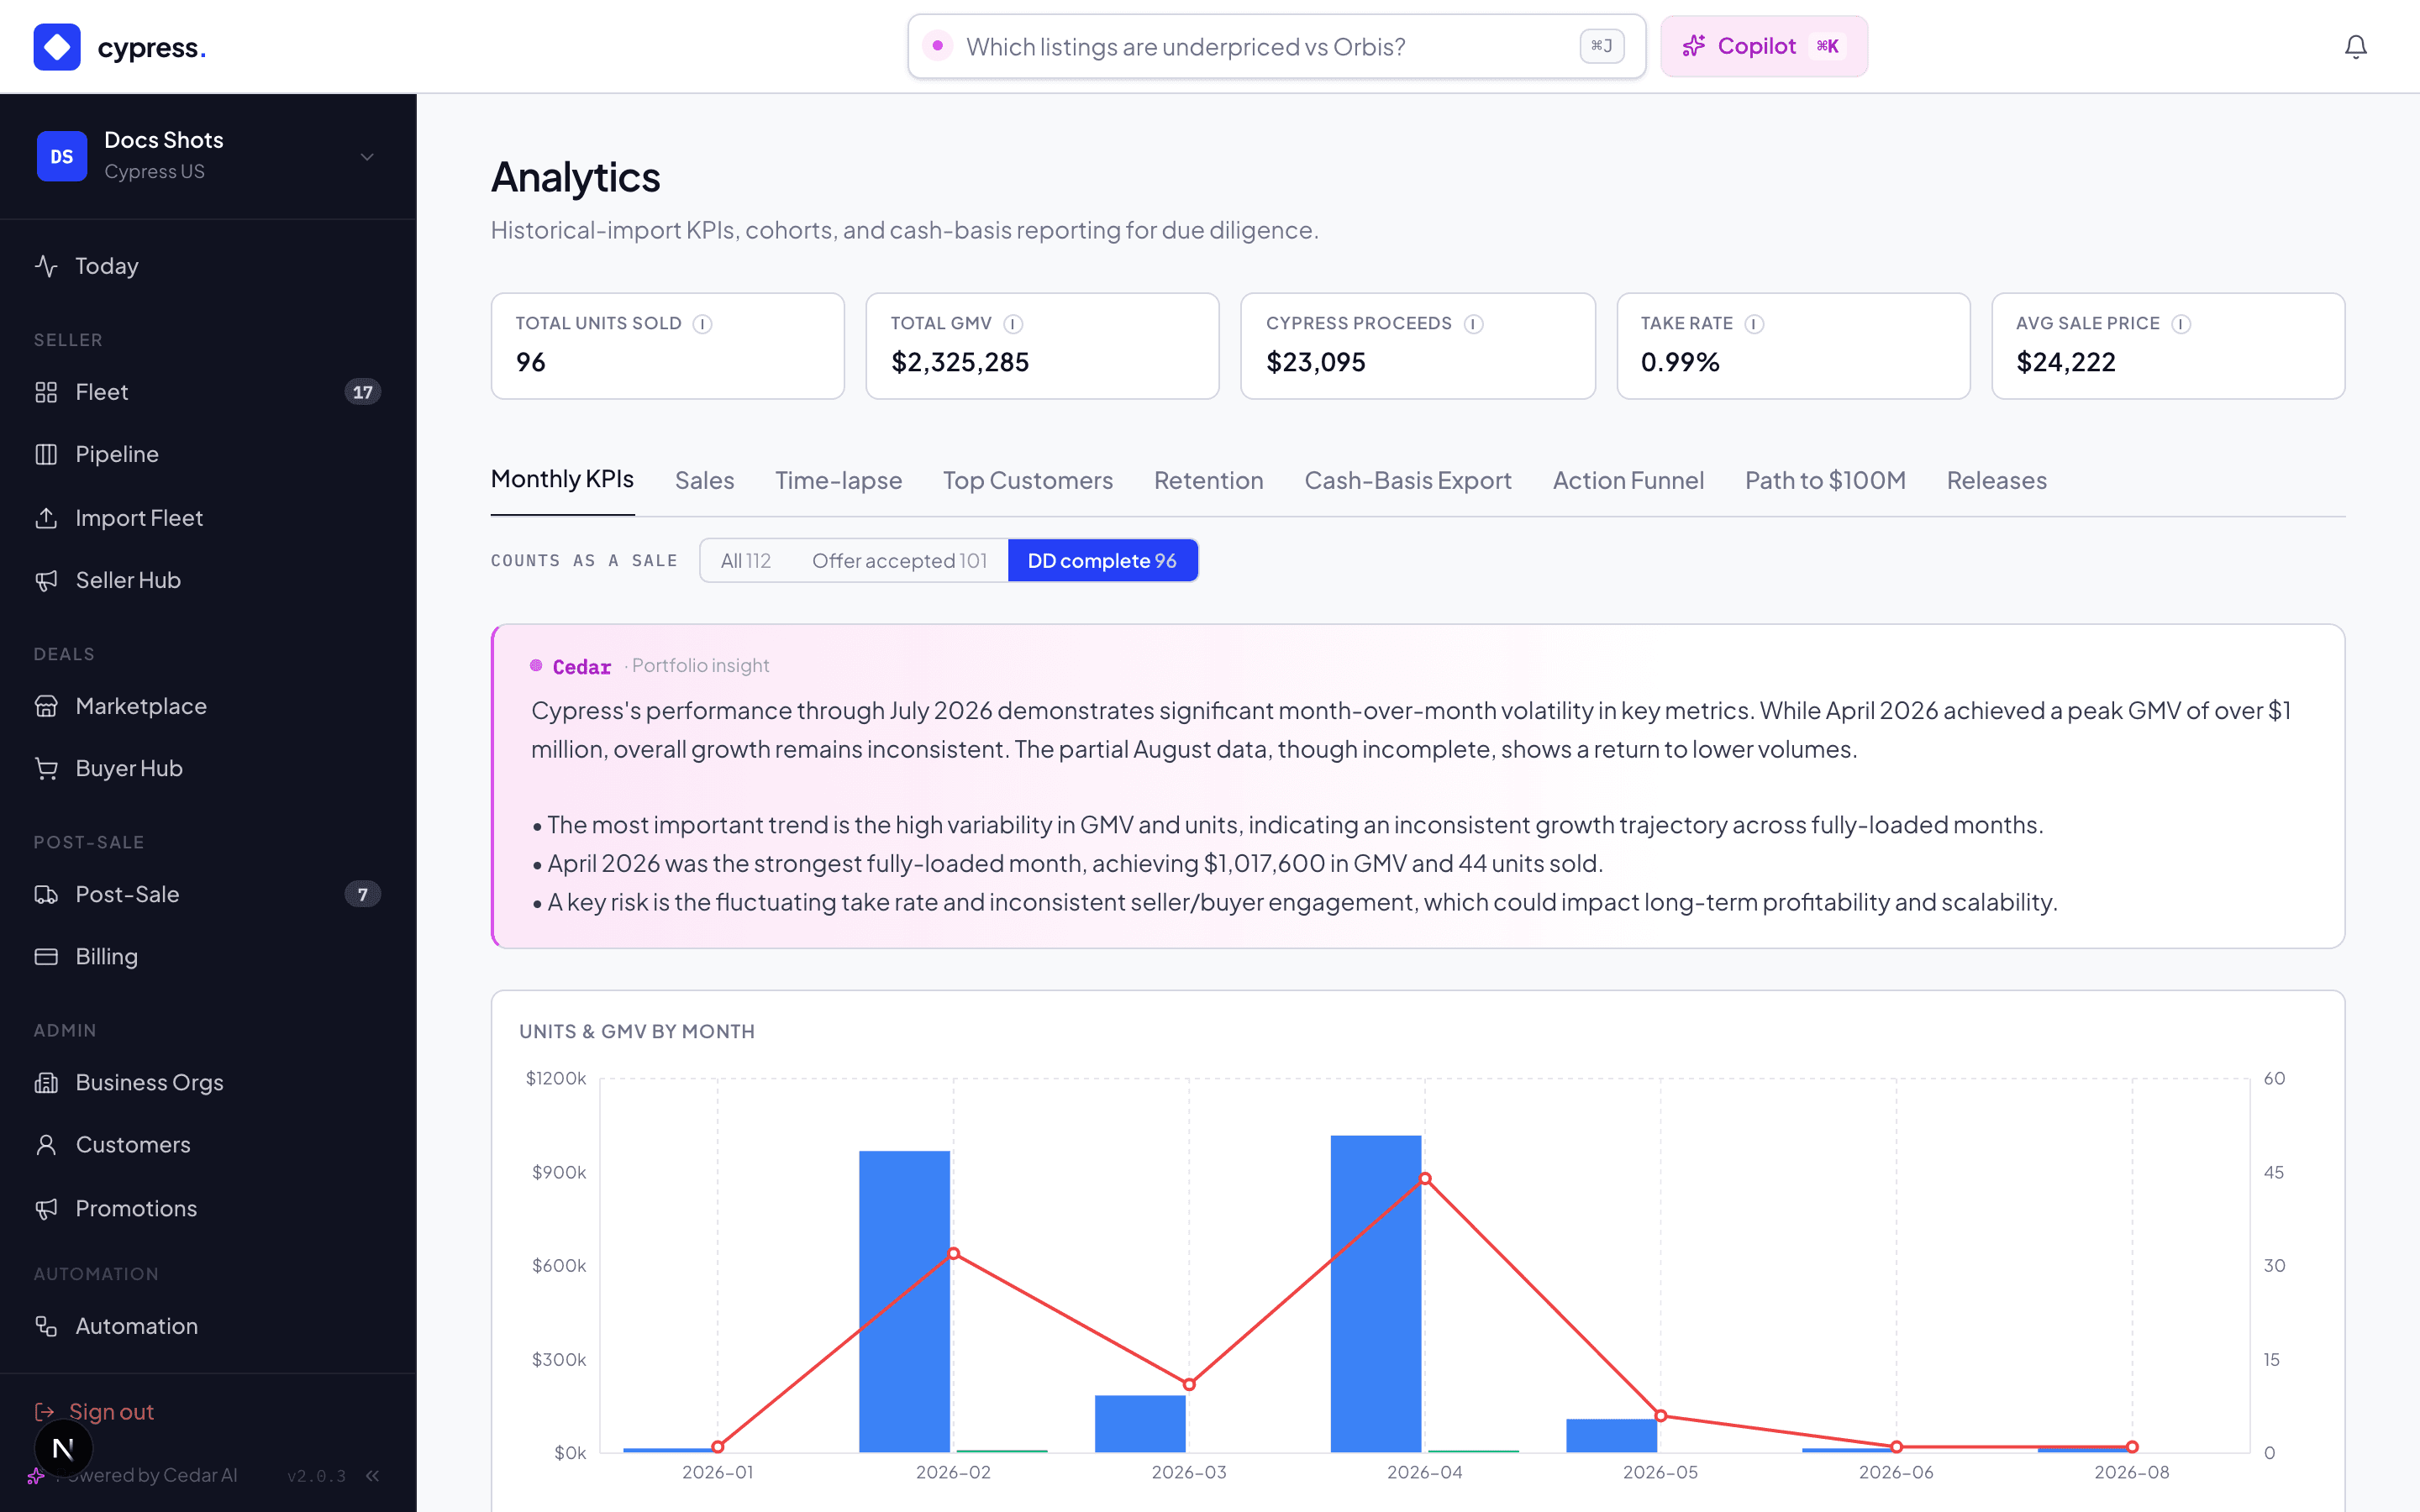
Monthly KPIs — units, GMV, commissions, take rate, average sale price, by month. Sales — the deal-level report. Time-lapse — the animated month-by-month replay. Top Clients — selling-org cohorts by volume. (Named clients, not customers: the people browsing cars are the Engagement report's Customers, and one word must not mean two populations.) Retention — the cohort grid: sell side or buy side, by units, GMV, or revenue, over 6/12 months or all time; who came back, who went dormant. Cash-Basis Export — the accountant's cut. Path to $100M — actuals against the base and stretch forecasts. Releases — what shipped when, so a metric kink can be matched to the feature that caused it.
Who uses Cypress and what they do — active users, the buyer and seller funnels, every action by side, and whether the data sources are collecting — is the next item in the Analytics menu, Platform activity. This page is about sales and money; that one is about people.
Every tab can produce an AI narrative — Cedar reads the same numbers you see and writes the paragraph you'd have written, with the caveats.
Reading a Sankey
Two Sankeys exist: the promotion Sankey on a promotion's analytics panel (channel → vehicle → outcome) and the channel Sankey on a vehicle's Seller Hub panel (channel → link/campaign → outcome). Both obey the same reading rules:
- Band width = event count. Outcomes are exactly three: Viewed, Saved, Offered.
- The gold "Sold" links are out-of-band — a sale is one event, not a flow of hundreds, so it's drawn as a marker thread rather than a proportional band. The on-screen help says the same.
- "Unattributed" is a real node — events with no known channel land there instead of vanishing, so the Sankey's total always matches the other panels.
The counting rules
- A sale is a vehicle whose status is SOLD today. A sold vehicle later archived over a failed post-sale is not counted — that deal didn't survive due diligence, and the report deliberately excludes it.
- GMV is the sum of sale prices under the page's stage definition; take rate is commission over GMV, same denominator.
- Temperature (HOT/WARM/COLD) is recent-engagement-derived — the next chapter defines it.
How Cedar can help here
Every tab's AI narrative button asks Cedar to read the same numbers you see and write the paragraph — trend, outliers, and caveats included. The Sakura insight on each promotion ends with one concrete next step; the per-vehicle Market History regenerates its summary on every view. The counting rules above bind the AI too: narratives are grounded in the tab's data under the page's stage definition, never free-styled.
Worked example
The Transit closes in June. Under the default stage it counts the day due diligence completed; in the Sales tab its row carries the $29,200, the standard-scheme commission, and the Marketplace channel; the June cohort of Birchwood's purchases gains one unit. On the promotion Sankey for "Fleet Vans Under $35k", the Transit's band runs Promotion → vehicle → Offered with the gold thread to Sold — the campaign email that resurfaced it to Dan is part of why that thread exists at all.
Under the hood
Analytics reads from rollup tables built by the worker, not from live transactional queries — which is why the page is fast and why event totals reconcile across panels. The stage selector switches the date column, never the row set logic.
Performance & Engagement — the customer 360
Two reports, two lenses, one funnel: what a company wants, what it actually trades, and Sakura's read on both.
Platform activity
Who uses Cypress and what they do: active users, funnels, buyers and sellers, organizations and people, the Cypress team, and who comes back.